Why this matters
Policies can’t be enforced by leadership without measurable target reports.
Give leadership tools they need
Reports should be thought of as tools to help leadership communicate the results the enterprise wants to see.
Spend time learning what reports are valuable to leadership and how accessibility can align with their vision and goals.
For example, leadership may prefer to point to a single number or average score. In other contexts, leaders may wish to dive deeper to drive specific results.
About accessibility program reports and targets
An organized program will encompass these basic components of measuring accessibility, reporting and aligning products or processes to targets.
1. A thing happens
- Application or process reaches a measurable state.
- This could be in a testing environment or live production setting.
2. A thing is measured
- Application or process is assessed.
- A manual audit or automated scan is recorded.
3. Report is produced
- This report is delivered to leadership.
- While the accessibility team may advise on the next steps, the process of re-aligning a team that’s missing targets or rewarding a team that does falls to leadership.
4. Target met?
- Ask: Does the product meet the targets leadership has set?
5. If yes and the product is accessible
Great news! Continue enhancing processes
6. If no, the target is not met, something is wrong
When a team misses targets it’s because they’re not receiving the support they need from the organization.
7. Discover what’s preventing success.
It’s not enough to just get a team in trouble for missing targets. The root cause of the failure must be discovered to make progress.
Why was this target missed?
- Were there barriers of awareness?
- Did the team lack skills or technical capacity?
- Was there a technical or procedural blocker?
- Did conflicting priorities seem to override the importance of policy?
Explore ways to gain alignment.
- Does the team need more training?
- Help removing a barrier?
- Changing a deadline?
- Additional budget?
Commit to meeting targets.
- Agree what processes must be modified to meet measurable goals
- Set a realistic date for commitment to be measurable
Reporting data sources
Don’t underestimate the value, nor the effort necessary, to assemble all of this data and present it.
To give leadership the data needed to enforce policies, you’ll collect information from manual testers, automated testing tools, project management queries, team surveys and training systems.
Manual and automated accessibility assessments
Manual testing
Manual testing is precisely that: a human actually testing the experience using the screenreader and browser combinations you need to support.
Experts can deliver an organized report of defects by severity. This is a necessary tool for improving the customer experience.
Limits of manual testing
A manual test isn’t the same as a usability study, but it is effective in uncovering the issues your customers experience.
Manual testing is performed by people, and perception of what constitutes a defect can vary slightly from one tester to the next. It will be helpful for your testers to reference your severity definitions, and use uniform testing acceptance criteria.
Automated testing
Automated tests find programmatic errors, but can’t describe actual customer experiences. Just like a spell checker, automation can flag non-issues while missing legitimate problems because it can’t understand context and intention.
How to use automated scans effectively
Scanning tools quickly pinpoint syntax defects in code. Some flagged issues won’t affect the customer experience, but you should exercise scrutiny and manual testing if a web page is riddled with invalid code and errors.
Limitations of automated scans
Testing tools have value. But it’s important to understand their drawbacks. Even the most robust tools can identify less than half of the potential defects on a page.
Code can be inaccessible for a person using their keyboard or screen reader without being flagged as invalid markup by an automated tools.
Practical examples
- Automated scans can instantaneously test checkboxes for properly associated labels and other code attributes, but can’t tell you if the labels make sense.
- Automation tools can flag an image for missing alt text, but can’t tell you if it would be better for the screen reader to ignore a particular decorative icon.
- Custom components, like an accordion expander, could be inaccessible with the keyboard and yet be formed of valid code that won’t raise an error.
Project management system
Query your project management system to track:
- Usage of atomic accessibility acceptance criteria before work begins
- Recorded accessibility defects by severity and age
Learning management systems
Collect the completion rate of accessibility training for each product team as compared to training policy targets. This data will be an indicator of commitment to meeting accessibility policy and correlates to better results.
Validation check of remediation
Unfortunately, it’s entirely possible for teams to believe, or simply claim, they have remediated defects when that is not the case.
In the interests of due diligence, remediation work must occasionally be manually validated for quality using the same methodology as the original assessment.
| Program | Data source | Report | Target |
|---|---|---|---|
| Automated assessment | Automated assessment application | Code defects by severity | Trend down |
| Manual assessment | Project management app | Defects by severity & age | Meet remediation deadlines |
| Accessibility training by role | Learning management system (LMS) | Completion rates | 100% trained |
| Accessibility KPIs by role | Regular surveys and process audit | Best practices adherence | Trend up |
| atomic accessibility acceptance criteria usage | Project management app | Usage statistics for UI projects | 100% usage |
Accessibility score variables
One way to deliver data to leadership and teams is to condense defects and best practice commitments into a singular accessibility score for every product release cycle.
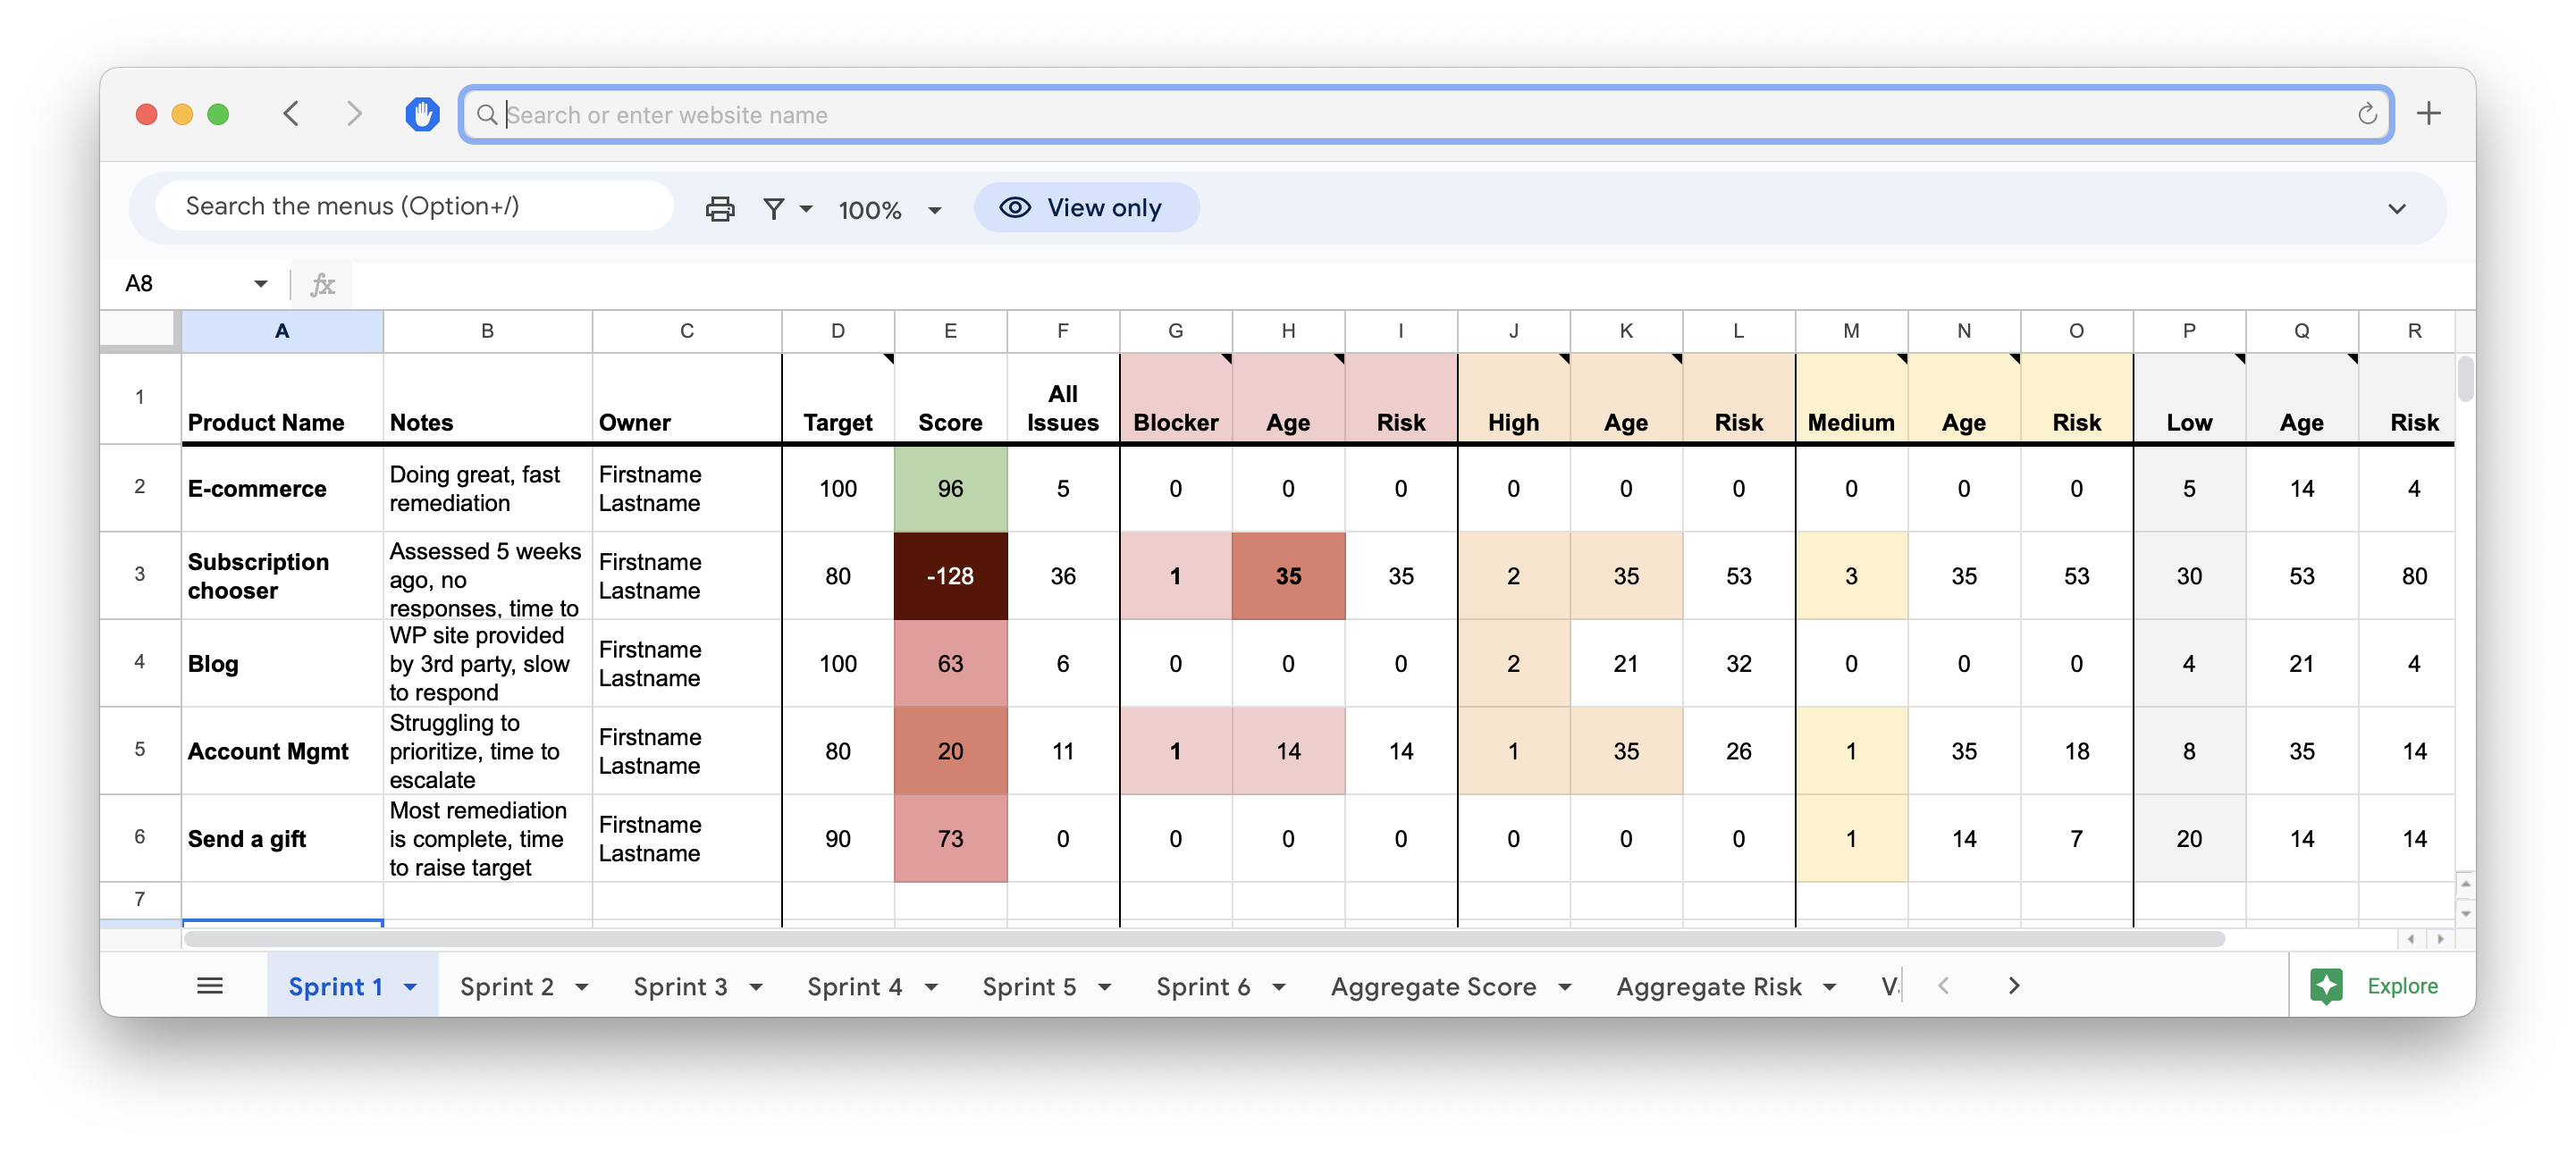
By tracking these scores over time, progress toward policy targets can be visualized.
What factors into an accessibility score?
1. Acceptance criteria usage
When teams don’t add acceptance/test criteria at the beginning of their work, they will often skip accessibility testing. Tracking the usage of acceptance criteria where applicable indicates when teams are committed to proper design, development and testing practices.
2. Quantity of defects by severity
Categorize defects by severity to add meaning to trends.
It can be difficult to describe progress on a large number of defects. But, if your reports can show high severity issues have been halved, you’ll present a more digestible concept for leadership.
3. Defect age
Track the number of days or release cycles from detection to remediation. When teams ignore high severity issues, it indicates misalignment of priorities with the enterprise.
This report will be used to enforce remediation policies.
4. Training completion
Tracking the percentage of team members who’ve completed training is an indicator of alignment with policy.
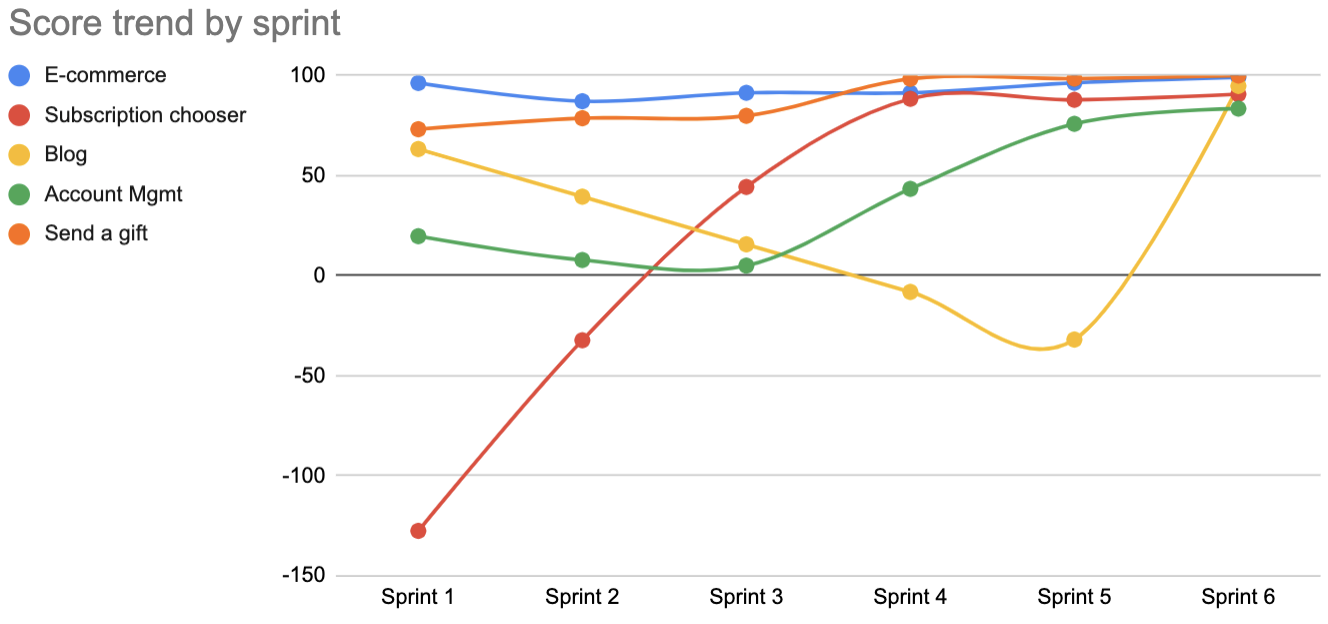
Sprint and quarterly reporting
What should be included in reports to teams and leadership?
1. Accessibility score trend
There are multiple ways to calculate an accessibility score, but what’s important to leadership is the trend of those scores.
By tracking the accessibility score variables every release cycle, you can produce a trending report leadership can use to enforce policy.
2. Risks to the organization
This can be a factor of severity, usage and the age of the issue. A high severity issue on a low traffic page might be less risk than a medium severity issue on a high traffic page.
3. Best practices compliance by role
Teams consistently following best practices should achieve positive accessibility outcomes.
This data can be collected by a sample survey or quiz of individual team members across the enterprise.
- Design systems
- Component library
- Infrastructure and architecture
- Product owners/managers
- Content strategy
- Designers
- Developers
- CMS authors
- QA testers
4. Remediated vs net new defects
Unfortunately, it’s entirely possible for teams to remediate defects from an assessment, while simultaneously creating new issues when practices don’t change. This happens often when product teams don’t reach out for help from accessibility coaches.
On creating attainable target scores
For products with dismally poor accessibility, it will be necessary to set attainable target scores.
For example, if a product is scoring 40/100, a target score of 60 can be set to give the team a sense of progress and the ability to level up. Once they meet the target score, it can be raised to the next attainable level.
The capability to assemble this data gives the accessibility team a direct way for leveraging leadership to enforce policies that improve these metrics.
Benchmarking reports
While you shouldn’t plan your entire program from casual benchmarking, you need to understand peer organizations and competitor efforts.
This can help you make the case for a stronger accessibility program if you’re behind.
Compare accessibility program against peers
It can be helpful to gauge your enterprise’s commitment to accessibility by understanding what peers or competitors are doing.
If you find your competitors are placing significant resources into accessibility innovation and compliance, that’s a helpful marker to point out to your leadership.
Compare compliance against peers
Run an automated assessment on peers and competitors. For example, an automated testing tool could produce an assessment on a competitor’s public facing website with little commitment.