Why this matters
It doesn’t matter what the job title is — program manager, project manager or data analyst — this role consumes data and produces reports that illustrate the story of inclusion.
This data gives leadership the tools they need to enforce the policies you’ve helped craft.
Team alignment
Can explain the strategies and tactics
The team will operate multiple long term measurable programs and complete many series of projects in service of strategic goals.
Every member of the team (including the data analyst) must demonstrate their ability to communicate the key performance indicators (KPIs) and tactics being used to achieve them.
This understanding allows your program to make progress as a unified team, report impact to leadership and show their effectiveness.
If you can’t communicate progress to leadership, your team will not seem effective or valuable to the enterprise.
Diligently uses a project management tool
There is no one right method of project management. Choose one and make it part of the team’s daily or weekly rituals.
Whether it’s an online to-do board, a workflow builder, or a physical kanban board of sticky notes, a single project management tool is central to the team’s sustained work and collaborative efforts.
Core responsibilities
The accessibility team’s programs must be shown to support the achievement of strategic goals.
This is where your data analyst comes in.
The accessibility team’s data analyst must be an inquisitive data driven role with the following assigned responsibilities.
Tracks programs in relation to strategic goals
Your accessibility teams work is turning the strategic goals into a cyclical series of actions or tactics that can be directly measured as outcomes. The data analysts job is to track and report those outcomes.
If a tactic isn’t helping accomplish a strategic goal, it should either be reformed or dropped.
Studies processes before implementation
Adapting and improvising tactics to the situation and culture of a specific environment is necessary to achieve results.
For example, part of the company’s public website might be using a 3rd party CMS platform to publish, and collects different accessibility defect data than an internally produced customer portal. This will make an apples to apples accessibility score impossible, but it doesn’t mean trends can’t be tracked over time.
Reports trends as a story
Finding ways to illustrate the accessibility team’s impact is crucial to the program’s success.
Simply reporting defects doesn’t tell leadership a compelling story. If the number of severe and medium defects rose by 8% last quarter, is that good? Is that bad? Don’t leave it to management to interpret your data.
The most basic reports will capture defect occurrence by product, training and usage of acceptance criteria across projects, but don’t stop there.
| Program | Data source | Report | Target |
|---|---|---|---|
| Automated assessment | Automated assessment application | Code defects by severity | Trend down |
| Manual assessment | Project management app | Defects by severity & age | Meet remediation deadlines |
| Accessibility training by role | Learning management system (LMS) | Completion rates | 100% trained |
| Accessibility KPIs by role | Regular surveys and process audit | Best practices adherence | Trend up |
| atomic accessibility acceptance criteria usage | Project management app | Usage statistics for UI projects | 100% usage |
Trends can be illustrated
Taking that same data and tracking trends over time tells a story leadership can understand. In this example, a report is produced every sprint cycle that generates an accessibility score.
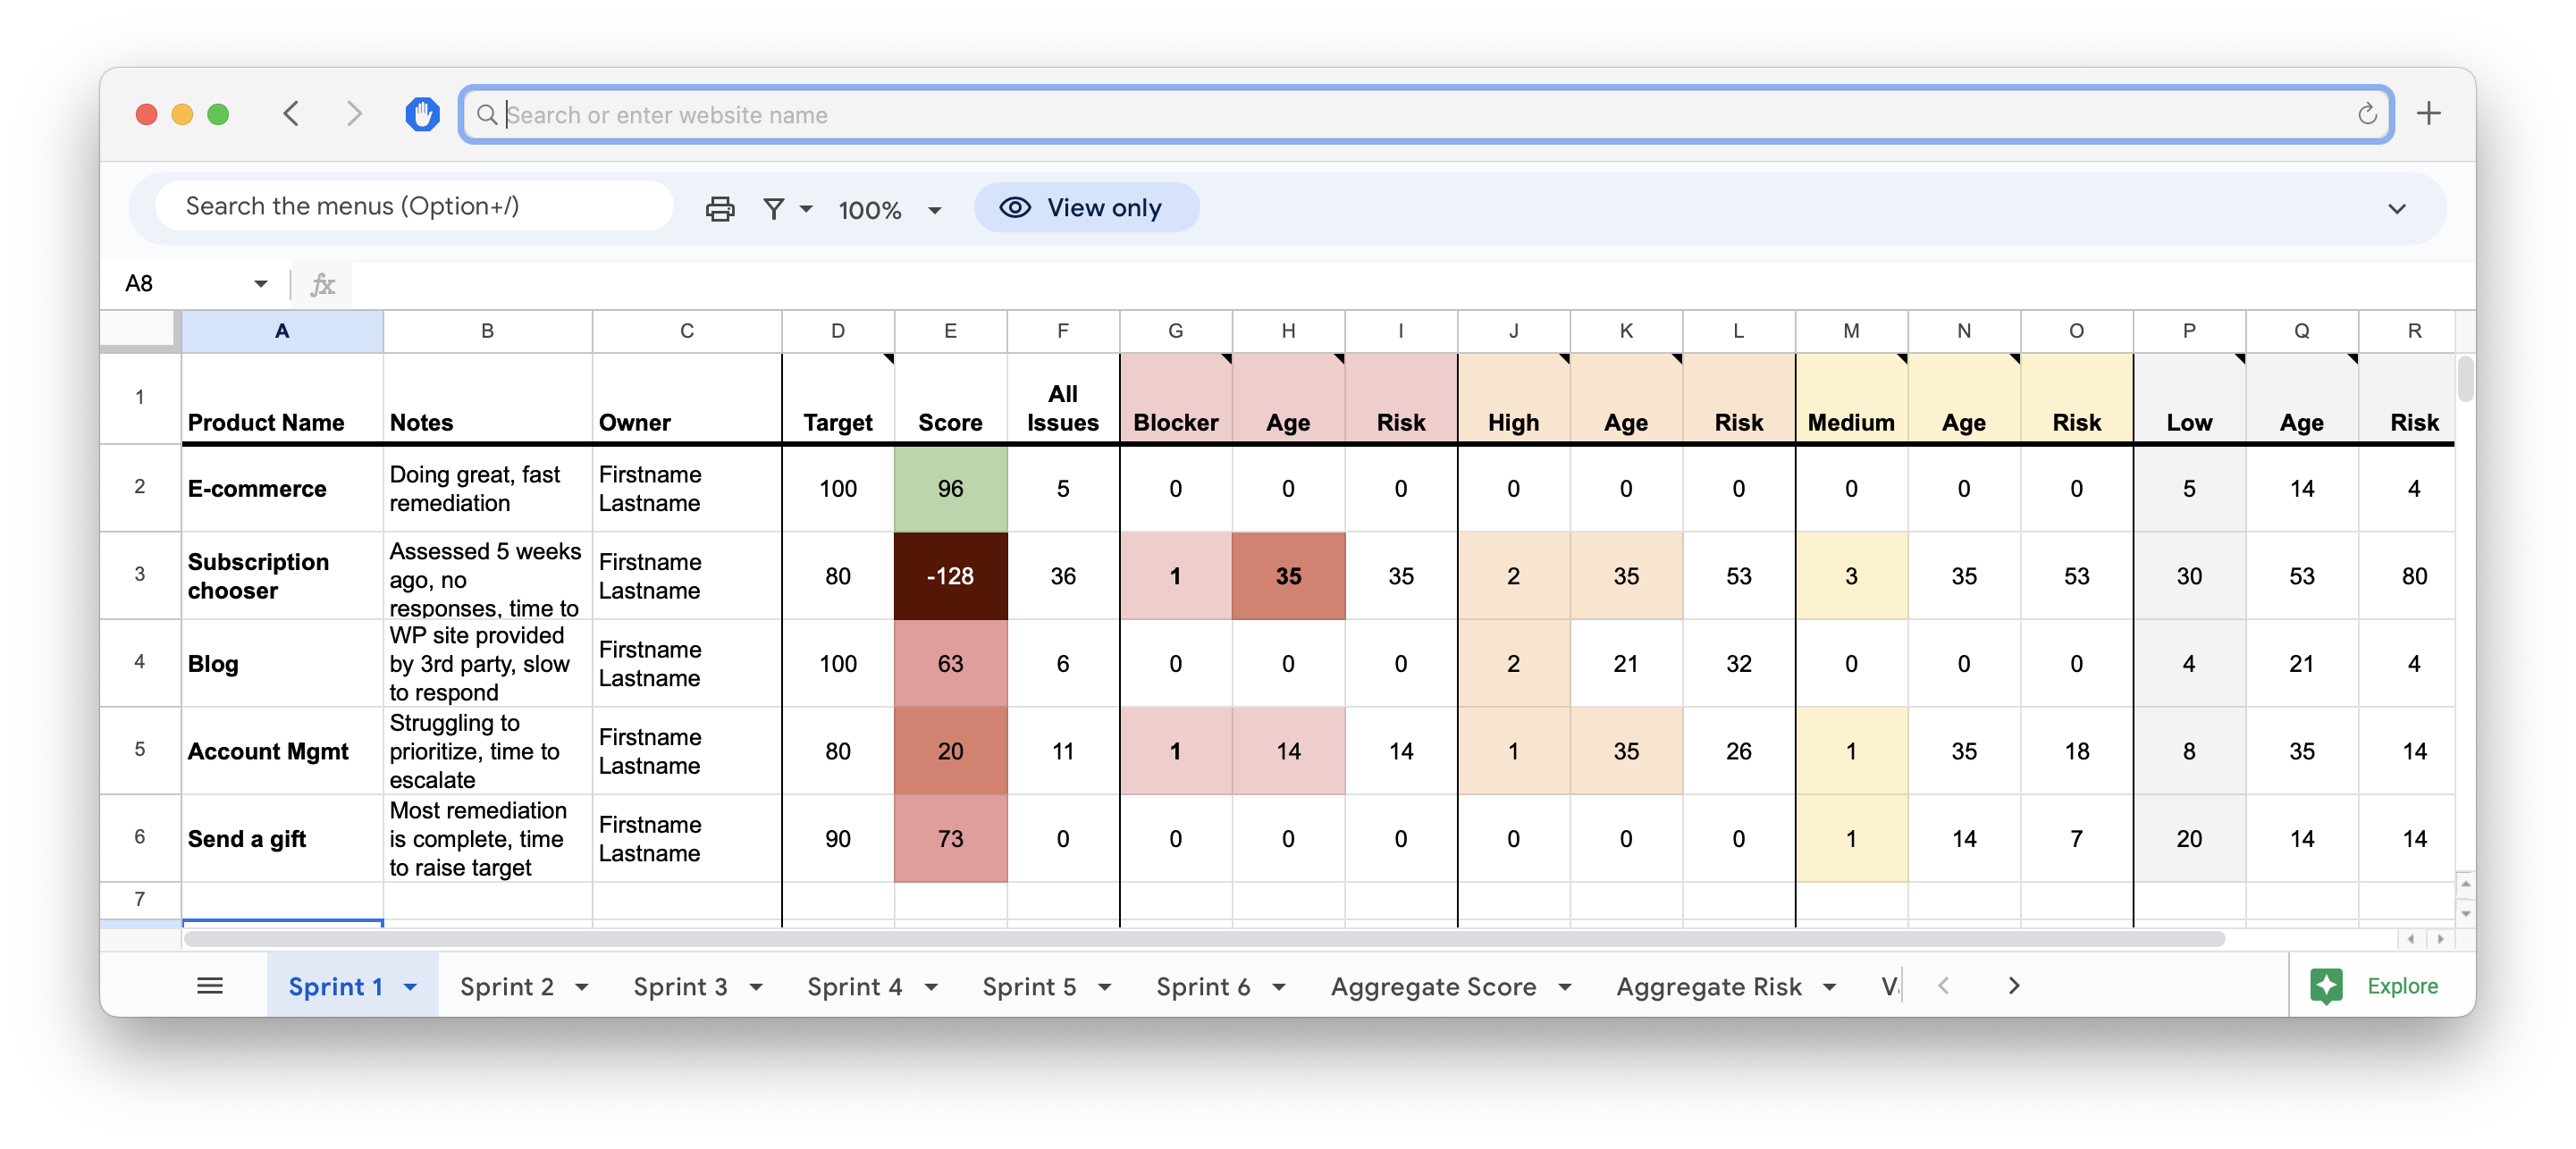
By tracking these scores over time, progress toward policy targets can be visualized.
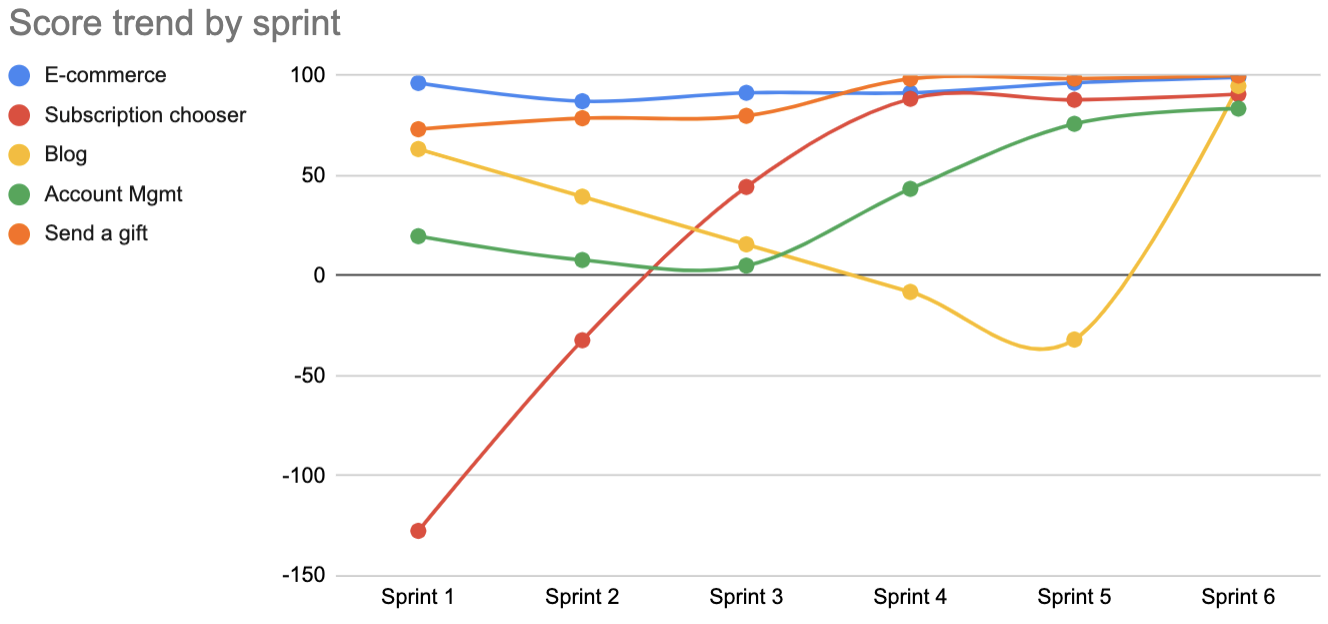
Here, we can see the following stories being illustrated:
- E-commerce team is consistently producing accessible experiences.
- Subscription chooser team made consistent progress toward remediation and training all quarter without prompting from leadership.
- Blog team ignored issues until leadership was leveraged to enforce policy in sprint 4.
- Account management team found a way to prioritize remediation mid-quarter in sprint 3.
- Send a gift team has made some good improvements following an assessment that found some issues.
Documents their processes
If siloed data is common within your organization it’s crucial the data manager be tasked and responsible for documenting how data is acquired and processed in the eventuality of turnover or changes in data collection.
An accessibility score will be generated from a mishmash of imported CSVs, recurring project management search queries and some manual entry combined with spreadsheet wizardry.
The process must be documented to be sustainable for the long term.